As a programmer, you often have to debug your own code or code written by a coworker. I don't like debugging, but as you know:
If debugging is the process of removing bugs, then programming must be the process of putting them in.
Unless you are an extraordinary developer, you will need to debug your code. Visual Studio provides great tools to help with this task. The main features are breakpoints, step-by-step execution, and inspecting variable values:
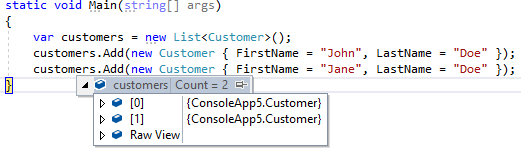
By default, the debugger doesn't always show useful values. In the previous screenshot, you cannot quickly distinguish the two customer instances. Let's see how to improve that and reduce the time spent debugging your application!
#Override the ToString method
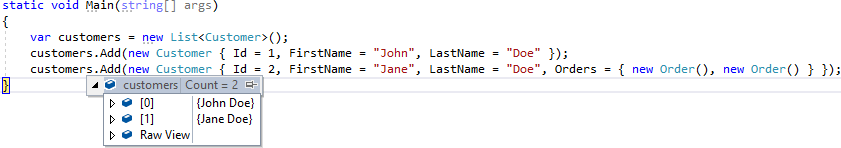
By default, the debugger displays the result of the ToString method. The simplest way to improve the display is to override ToString and return something more useful:
C#
public class Customer
{
    public int Id { get; set; }
    public string FirstName { get; set; }
    public string LastName { get; set; }
    public List<Order> Orders { get; } = new List<Order>();

    public override string ToString()
    {
        return $"{FirstName} {LastName}";
    }
}
#Use the DebuggerDisplay attribute
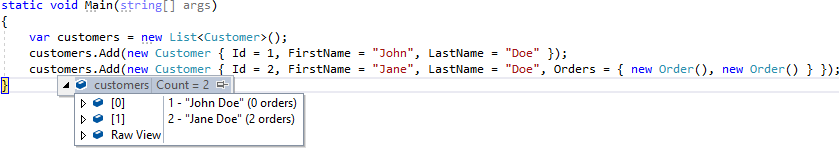
When you don't want to override ToString just for debugging purposes, you can use the DebuggerDisplay attribute. Its value uses a format similar to C# 6 string interpolation, but the text inside curly braces is an expression evaluated by the debugger engine. An expression can be a property name or something more complex, such as {Count > 0 ? Count : 0}.
C#
[DebuggerDisplay("{Id} - {FullName} ({Orders.Count} orders)")]
public class Customer
{
    public int Id { get; set; }
    public string FirstName { get; set; }
    public string LastName { get; set; }
    public List<Order> Orders { get; } = new List<Order>();

    public string FullName => $"{FirstName} {LastName}";
}
Evaluating expressions in the debugger is expensive, so avoid putting too many in the display value. Instead, consolidate them into a single private property and reference only that property in the DebuggerDisplay attribute.
C#
[DebuggerDisplay("{DebuggerDisplay,nq}")] // nq means no quote
public class Customer
{
    [DebuggerBrowsable(DebuggerBrowsableState.Never)]
    private string DebuggerDisplay => $"{Id} - {FullName} ({Orders.Count} orders)";
}
I use the nq format to prevent Visual Studio from adding quotes around the value. You can find valid formats in the documentation.
Note that you can also apply this attribute to a type you don't own by using it at the assembly level and specifying the Target property:
C#
[assembly: DebuggerDisplay("{Host}", Target = typeof(Uri))]
#Hide code to the debugger
You can annotate your code with attributes to control how the debugger behaves when stepping through code. For instance, you may not want the debugger to step into generated code. You can use one of the following attributes:
C#
static void Main()
{
    GeneratedMethod(); // Step into...
}

[DebuggerNonUserCode]
private static void GeneratedMethod() // show as External Code in the call stack
{ // do not step here
    MyCode();
}

private static void MyCode()
{ // ... step here
}
The GeneratedMethod method is not visible in the call stack:
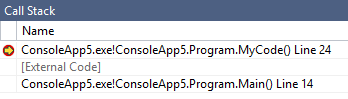 Call Stack with DebuggerNonUserCodeAttribute
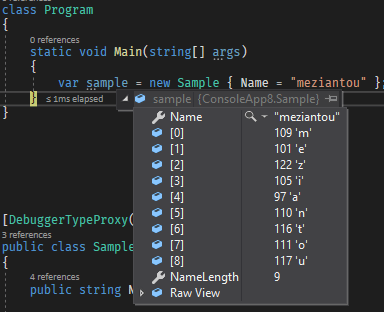
#Use the DebuggerTypeProxy attribute
The DebuggerTypeProxyAttribute attribute specifies a display proxy for a type, letting you tailor how the type appears in the debugger. When the attribute is present, the expression evaluator substitutes the proxy type for the original type. This is useful when you want to expose additional properties that don't exist on the original type.
C#
[DebuggerTypeProxy(typeof(SampleDebugView))]
public class Sample
{
    public string Name { get; set; }

    private class SampleDebugView
    {
        private readonly Sample _sample;

        public SampleDebugView(Sample sample)
        {
            _sample = sample;
        }

        public string Name => _sample.Name;
        public int NameLength => _sample.Name.Length;

        [DebuggerBrowsable(DebuggerBrowsableState.RootHidden)]
        public char[] NameCharacters => _sample.Name.ToCharArray();
    }
}
You can check real examples in the .NET framework: https://github.com/dotnet/runtime/search?q=DebuggerTypeProxy&type=Code
#Conclusion
The Visual Studio debugger is a powerful tool. It lets you quickly debug your code using breakpoints, variable inspection, and more. You can further customize it by annotating your types with debugger attributes. These attributes can help reduce the time spent debugging your application.
Do you have a question or a suggestion about this post? Contact me!